Fachbereich Geowissenschaften


Springe direkt zu: Inhalt


Service-Navigation


Hauptnavigation/Hauptmenü: Links auf direkt erreichbare, übergeordnete Webseiten


Grafischer Identitätsbereich:

Planetary Sciences / Remote Sensing

Weitere Service-Funktionen


Navigation/Menü: Links auf weitere Seiten dieser Website und Banner


09.02.2006
HRSC Bildserie #227 - Phlegethon Catena (Orbit 1217)

HRSC Press Release #227 - Phlegethon Catena (orbit 1217)


Senken und Tektonische Gräben von Phlegethon Catena

Pits and tectonic grabens in Phlegethon Catena
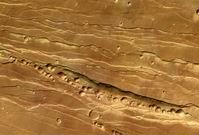
RGB Colour Image #1
RGB Colour Image #1
Am 29. Dezember 2004 nahm die hochauflösende Stereokamera (HRSC) auf der ESA-Sonde Mars Express im 1217 einen Teil der Region von Phlegethon Catena mit einer Auflösung von ungefähr 11,9 Metern pro Bildpunkt auf. Die Abbildungen zeigen hiervon einen Ausschnitt bei 33,9° nördlicher Breite und 253,1° östlicher Länge.

On 29 December 2004 the High-Resolution Stereo Camera (HRSC) onboard the ESA spacecraft Mars Express obtained image data in orbit 1217 with a ground resolution of approximately 11.9 metres per pixel. The data were acquired in the region of Phlegethon Catena, at approximately 33.9° northern latitude and 253.1° eastern longitude.
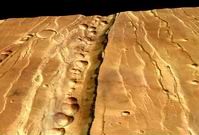
Perspective view #1
Perspective view #1
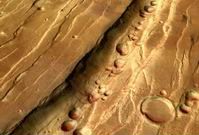
Die Region von Phlegethon Catena, südöstlich von Alba Patera gelegen, zeigt eine Vielzahl tektonischer Gräben. Bei diesen handelt es sich um Blöcke, die aufgrund von Krustendehnung relativ zur Umgebung abgesunken sind. Innerhalb des Farbbildes verlaufen diese Gräben ungefähr von Nordosten nach Südwesten. Ihre Breite beträgt zwischen 500 Metern und 10 Kilometern. Die Reihe dicht beieinander liegender Senken, die in derselben Richtung wie die Gräben angeordnet sind, wird als Catena bezeichnet. Die Senken besitzen keinen Rand und sind kreisförmig bis elliptisch geformt. Ihre Durchmesser betragen zwischen 0,3 und 2,3 Kilometern.

Perspective view #2
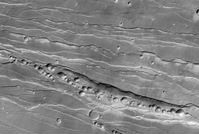
Grayscale Nadir Image
Located southeast of Alba Patera, Phlegethon Catena is a region exhibiting a high density of tectonic grabens, blocks of terrain that dropped relative to their surroundings as a result of extension. Within the colour image, this swarm of grabens trends roughly northeast-southwest, with individual widths ranging from approximately 0.5 to 10 km. The series of closely spaced depressions that exhibit a similar orientation to the grabens are described by the term catena. These depressions are rimless, circular to elliptical and range from roughly 0.3 to 2.3 km across.

Grayscale Nadir Image
Die Gräben entstanden vermutlich durch Spannungen, die mit der Entstehung des Vulkans Alba Patera in Verbindung stehen, der 3 bis 4 Kilometer über die Umgebung aufragt, oder durch die bis zu 10 Kilometer hohe Tharsis-Aufwölbung im Süden. Die Entstehung der Senken selbst ist umstritten, sie könnten durch den Abtransport von Material im Untergrund oder durch Dehnung im Untergrund und anschließendes Einbrechen der Oberfläche verursacht worden sein.

The grabens may have formed as the result of stresses associated with the formation of Alba Patera, a volcano rising 3 to 4 km above the surrounding plains, or by the up to 10 km high Tharsis rise located to the south. It is unclear what process is responsible for the chain of depressions; collapse of the surface due to the removal of subsurface material is one possibility, while others suggest that tension cracks may have formed in the subsurface and caused subsequent collapse.
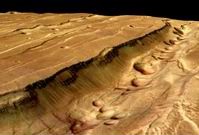
Perspective view #3
Perspective view #3
Die Farbansichten wurden aus dem senkrecht blickenden Nadirkanal und den Farbkanälen erstellt, die Schrägansicht wurde aus den Stereokanälen der HRSC berechnet. Die Anaglyphen werden aus dem Nadirkanal und einem Stereokanal abgeleitet. Die schwarzweißen Detailaufnahmen wurden dem Nadirkanal entnommen, der von allen Kanälen die höchste Auflösung zur Verfügung stellt.

The colour scenes have been derived from the three HRSC-colour channels and the nadir channel. The perspective views have been calculated from the digital terrain model derived from the stereo channels. The anaglyph image was calculated from the nadir and one stereo channel. The black and white high resolution images were derived form the nadir channel which provides the highest detail of all channels.
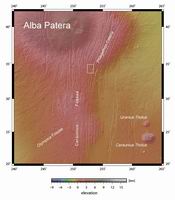
Context Map (MOLA)
Context Map (MOLA)
Das Kameraexperiment HRSC auf der Mission Mars Express der Europäischen Weltraumorganisation ESA wird vom Principal Investigator Prof. Dr. Gerhard Neukum (Freie Universität Berlin), der auch die technische Konzeption der hochauflösenden Stereokamera entworfen hatte, geleitet. Das Wissenschaftsteam besteht aus 40 Co-Investigatoren aus 33 Institutionen und zehn Nationen. Die Kamera wurde am Deutschen Zentrum für Luft- und Raumfahrt (DLR) unter der Leitung des Principal Investigators (PI) G. Neukum entwickelt und in Kooperation mit industriellen Partnern gebaut (EADS Astrium, Lewicki Microelectronic GmbH und Jena -Optronik GmbH). Sie wird vom DLR -Institut für Planetenforschung in Berlin-Adlershof betrieben. Die systematische Prozessierung der Daten erfolgt am DLR. Die Darstellungen wurden vom Institut für Geologische Wissenschaften der FU Berlin in Zusammenarbeit mit dem DLR-Institut für Planetenforschung erstellt.

The High Resolution Stereo Camera (HRSC) experiment on the ESA Mars Express Mission is led by the Principal Investigator (PI) Prof. Dr. Gerhard Neukum who also designed the camera technically. The science team of the experiment consists of 40 Co-Investigators from 33 institutions and 10 nations. The camera was developed at the German Aerospace Center (DLR) under the leadership of the PI G. Neukum and built in cooperation with industrial partners (EADS Astrium, Lewicki Microelectronic GmbH and Jena-Optronik GmbH). The experiment on Mars Express is operated by the DLR Institute of Planetary Research, through ESA/ESOC. The systematic processing of the HRSC image data is carried out at DLR. The scenes shown here were created by the PI-group at the Institute for Geological Sciences of the Freie Universitaet Berlin in cooperation with the German Aerospace Center (DLR), Institute of Planetary Research, Berlin.


Download
hochaufgelöste Bilddaten / full resolution image data

Context Map (MOLA):TIF (744.8 KBs) / JPG (313.3 KBs)
Grayscale Nadir Image:TIF (16.7 MBs) / JPG (10.4 MBs)
RGB Colour Image #1:TIF (50.1 MBs) / JPG (12.8 MBs)
Perspective view #1:TIF (50.1 MBs) / JPG (10.3 MBs)
Perspective view #2:TIF (50.1 MBs) / JPG (10.3 MBs)
Perspective view #3:TIF (50.1 MBs) / JPG (8.5 MBs)


© 2003 - 2024 Freie Universität Berlin  
21.09.2006

Diese Grafiken werden nur in der Druckvorschau verwendet: